Multi-gene views
In addition to exploring the expression of single genes, you can also search for multiple genes. You can visualize the expression of each gene in a Violin plot, or visualize the differential expression of each gene across all comparisons.
Searching for multiple genes
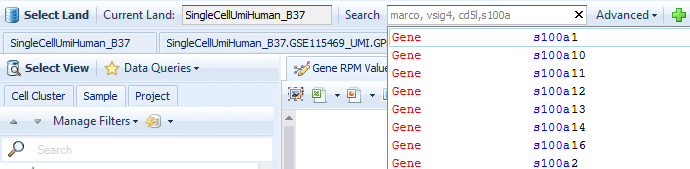
In the Search Bar type in multiple gene IDs, separated by commas.
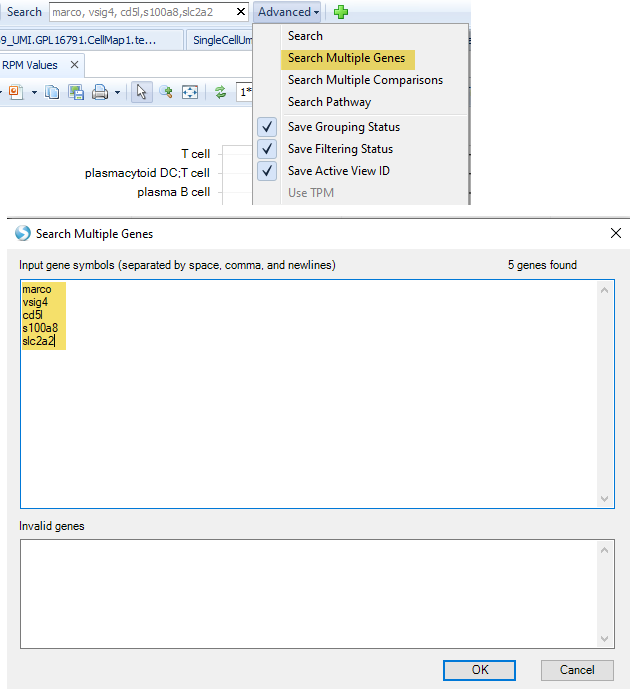
Or, you can click the Advanced dropdown menu and select Search Multiple Genes.
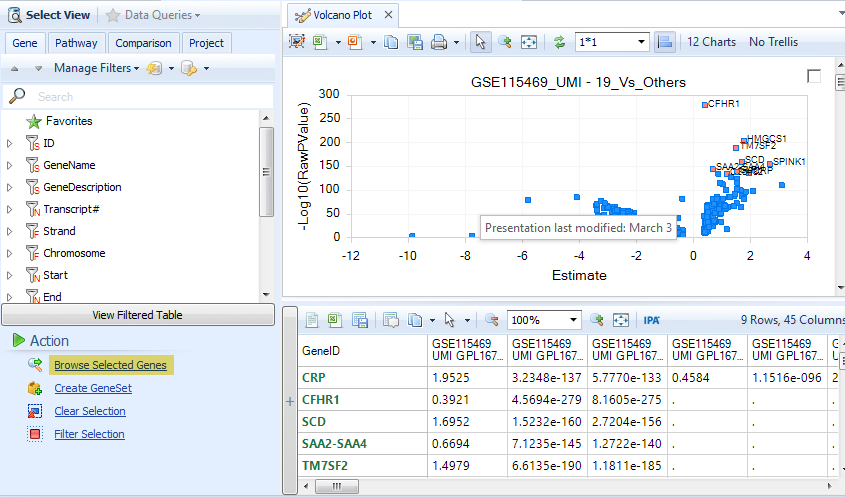
If you are exploring one or more comparisons, for example in a Volcano Plot, you can select one or more genes then select Browse Selected Genes at the bottom-left in the Action toolbar.
Multi-gene violin plot
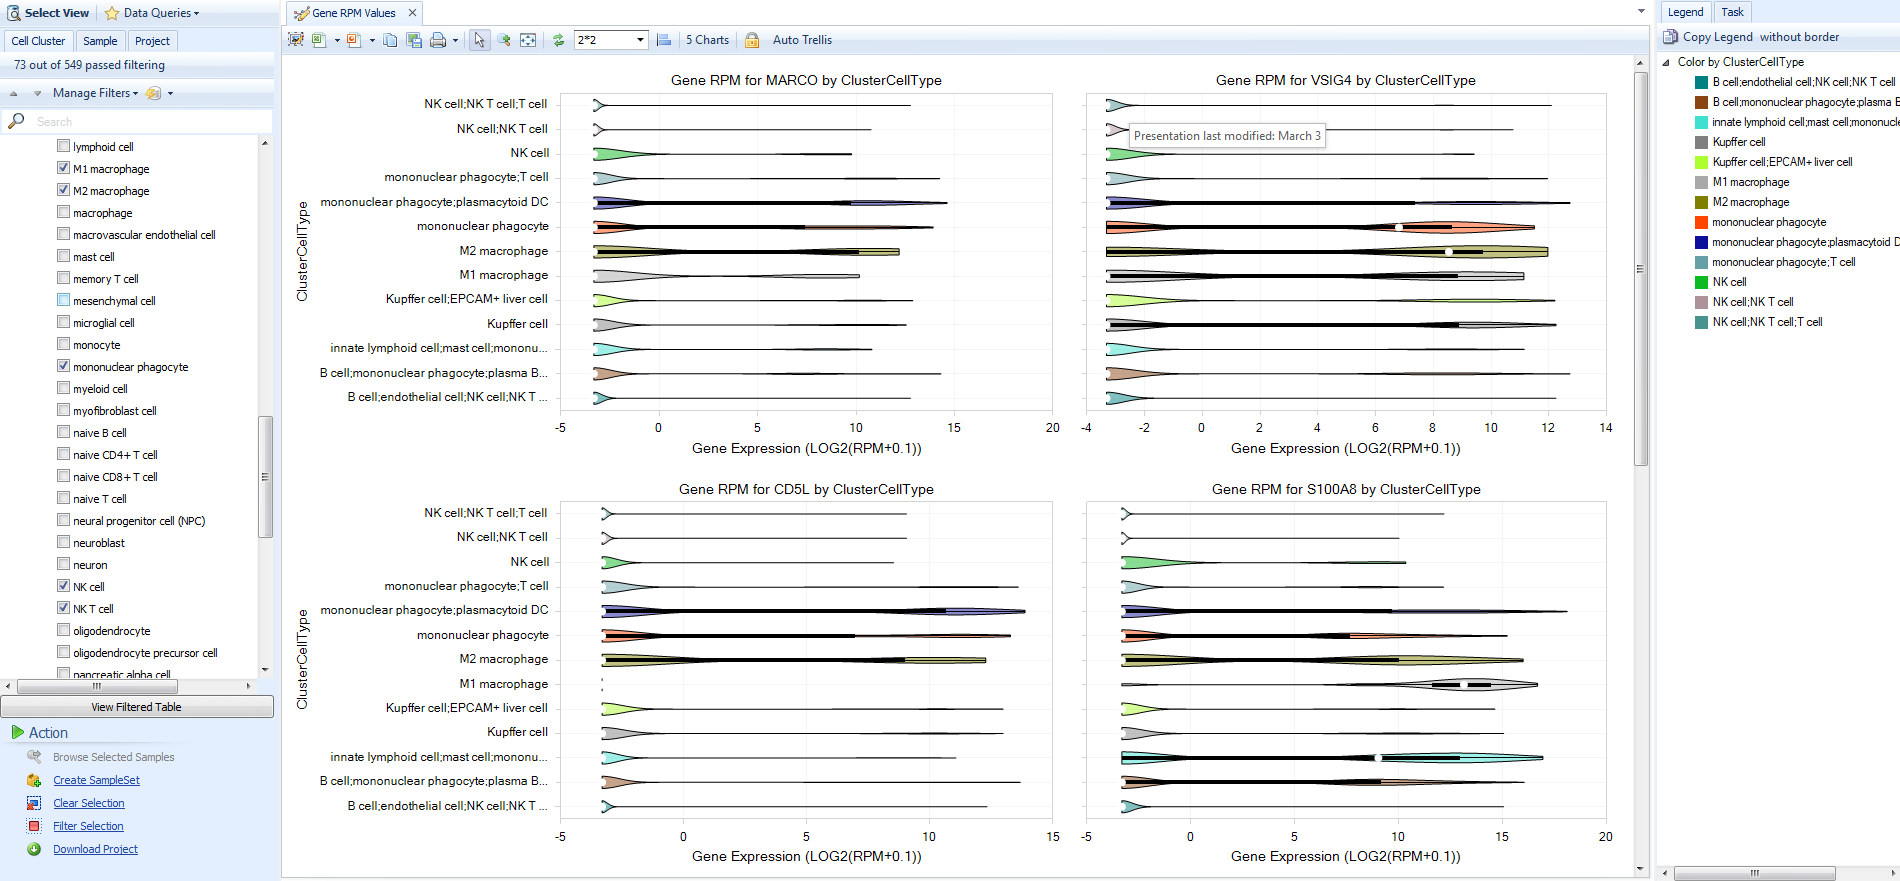
After searching for more than one gene, the default View is the multi-gene Gene RPM View. Each gene is plotted on a separate pane, so you can scroll down to see gene expression. Use the filters on the left to refine by tissue, disease, clinical metadata, or ClusterCellType. Use the Task tab on the right to Specify Profile Columns, or change the ordering in each plot by mean expression with Sort Profiles. You can also Hide non-expressing groups to hide any Y-axis groupings with no cells expressing a given gene.
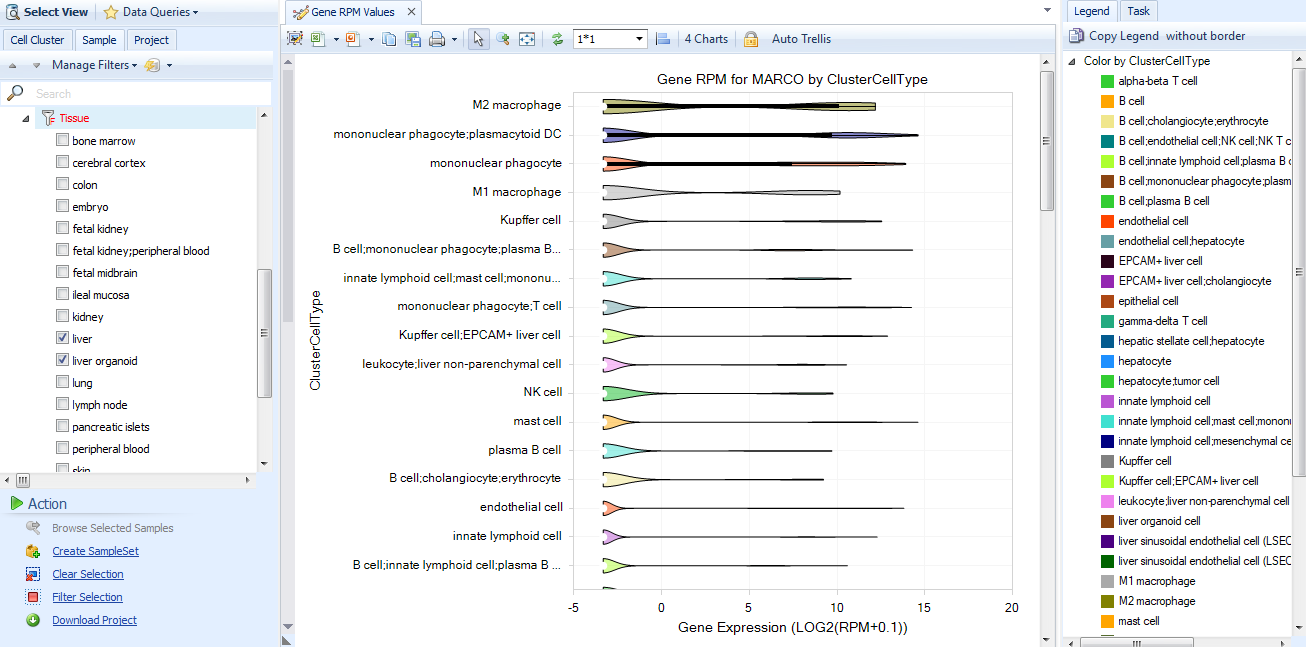
Above the plot, you will see the Layout controller, which is set to 1*1 by default. If you would like to see multiple genes side-by-side, you can change the layout to 2*2, 3*3, or you can specify your own layout. Because of the space constraints, you may want to filter to a few groupings first.
For example, after filtering for tissue=liver and searching for marco, vsig4, cd5l, s100a8, notice the ClusterCellTypes with expression. Use the Cell Cluster metadata to select specific cell types like all macrophages, including liver-resident Kupffer cells. Change the layout to 2*2.