Summarization of CNV Data
Summary Statistics
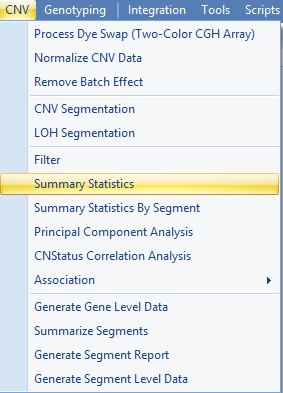
Array Studio can also provide summary statistics on CNV data using the module, Summary Statistics. This module is available in the CNV Menu | Summary Statistics. Open it now.
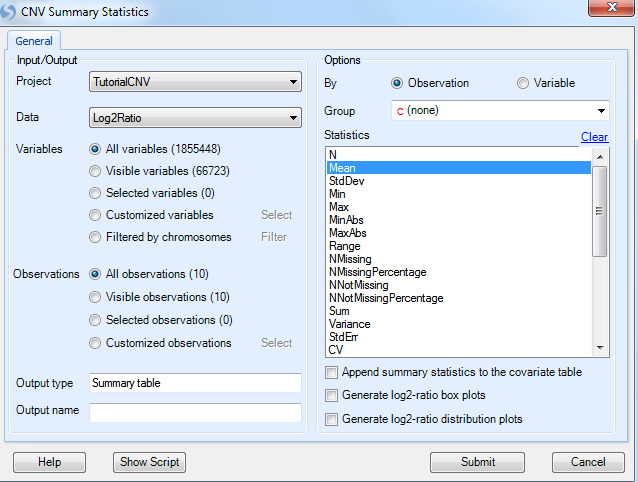
This brings up the CNV Summary Statistics window. All module windows in Array Studio follow a similar pattern to this one.
-
First, the user can select the Project and Data to be analysed; in this case our Project is Tutorial CNV and our Data is Log2Ratio.
-
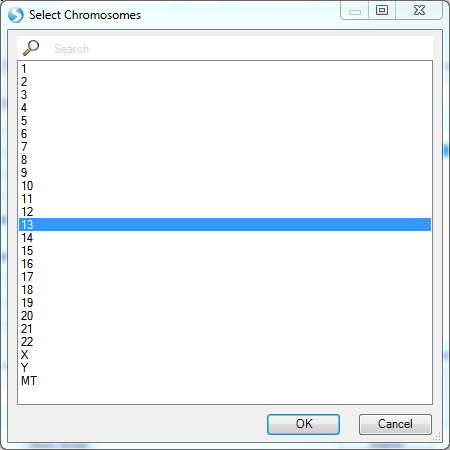
Next, if the user has generated a list of variables/markers for analysis, this can be selected through Customized variables. The user can also manually choose particular chromosomes for analysis. For demonstration purposes, let’s only generate statistics on chromosome 13. To do this, check Filtered by chromosomes option and click the Filter button.
-
The Observations section allows the user to choose a list of subjects to analyze. Leave this to All observations (10).
-
Under Options, the user has a number of choices. The user has the option to summarize either each Observation or each Variable. Here we choose Observation to summarize statistics across all markers on chromosome 13 for each sample.
-
The user can also choose to summarize by a specific annotation table (for observations) or design table (for variables) column as Group. For example, if the user is interested in statistics for each Syndrome group, they could choose that column here.
-
Finally, the Statistics section contains a number of different statistics that can be calculated, including N, Mean, StdDev, Min, Max, MinAbs, MaxAbs, Range, NMissing, NMissingPercentage, NNotMissing, NNotMissingPercentage, Sum, Variance, StdErr, CV, Median, IQR, Skewness, Kurtosis, MAD, NPositive, NNegative, PositivePercentage, NegativePercentage, PositiveChangeSize, NegativeChangeSize, PositiveMean, NegativeMean and GenometricMean. Choose Mean here to summarize the mean of Log2Ratio values of all variables for each observation.
-
User also has the option to Append the summary statistics to the covariate table as new design column.
-
In addition to the table report, user can also choose to generate log2-ratio box plots or distribution plots in correspondence to the table. Leave these unchecked for this tutorial.
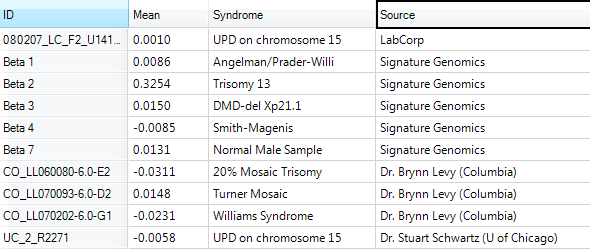
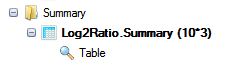
A new Table is generated under the Table | Summary section of the Solution Explorer, called Log2Ratio.Summary.
Note that we may still be filtering for the single chip, so we need to reset all filters in the Filter tab of the View Controller to see all the samples in the table.
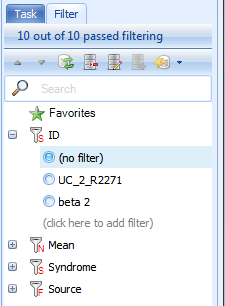
Once unfiltered, the TableView should include 10 rows and 3 columns. It is clear that for sample Beta 2, which is the patient with Trisomy 13, the mean is 0.32545, significantly higher than for any of the other samples. This module can be used to perform similar analyses as desired, generating other types of statistics.