Proteomics views
In addition to visualizing RNA-seq and microarray expression data, the Land Explorer can be used to visualize data from proteomics assays, such as Reverse Phase Proteomics Array (RPPA) and Mass Spectrometry (MS).
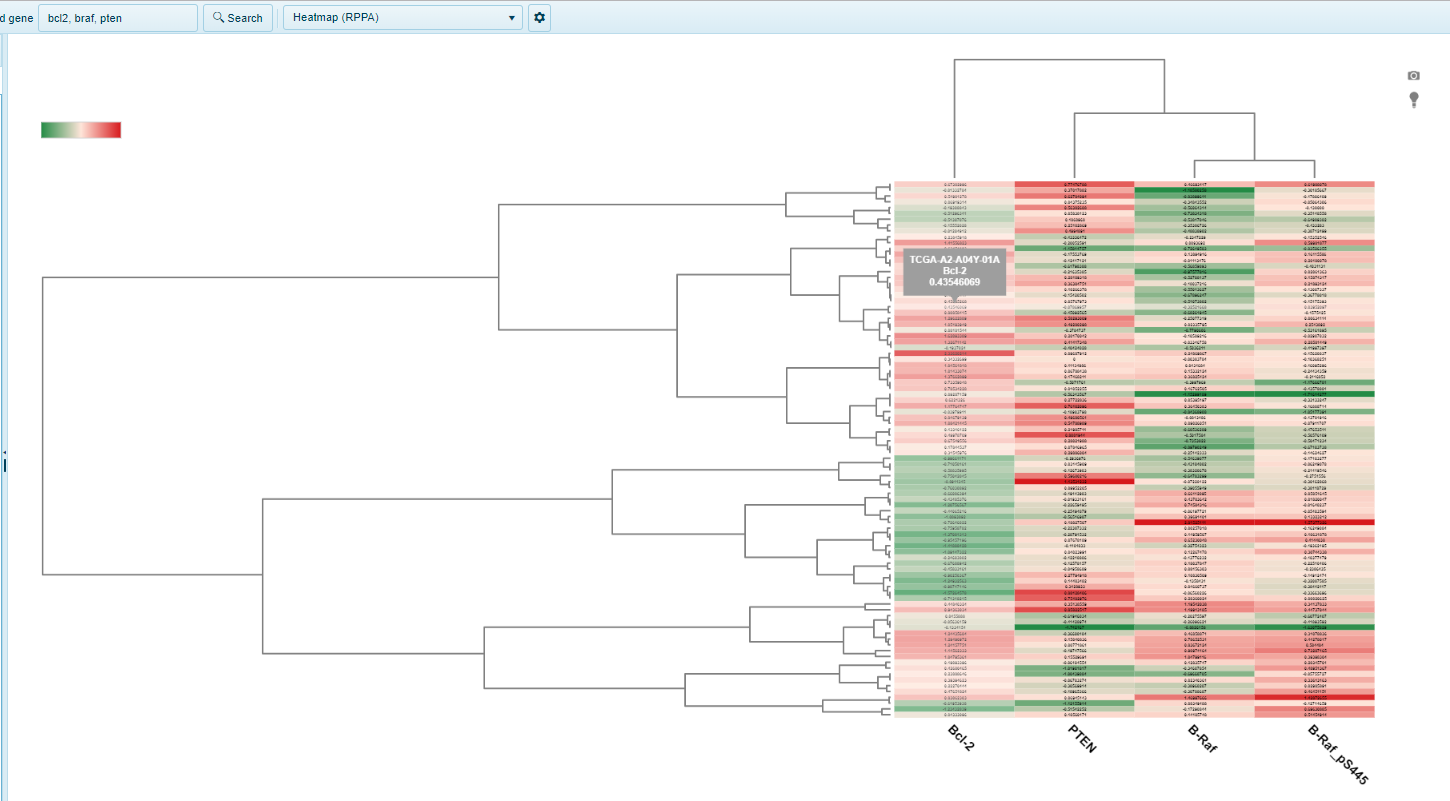
RPPA Heatmap
The RPPA Heatmap view shows reverse phase protein array ratio (sample vs universal human reference) for multiple genes. Each gene searched is identified by column, while each sample is represented as a row. RPPA data was only generated for a subset of proteins, so this view may not be available for many genes searched.
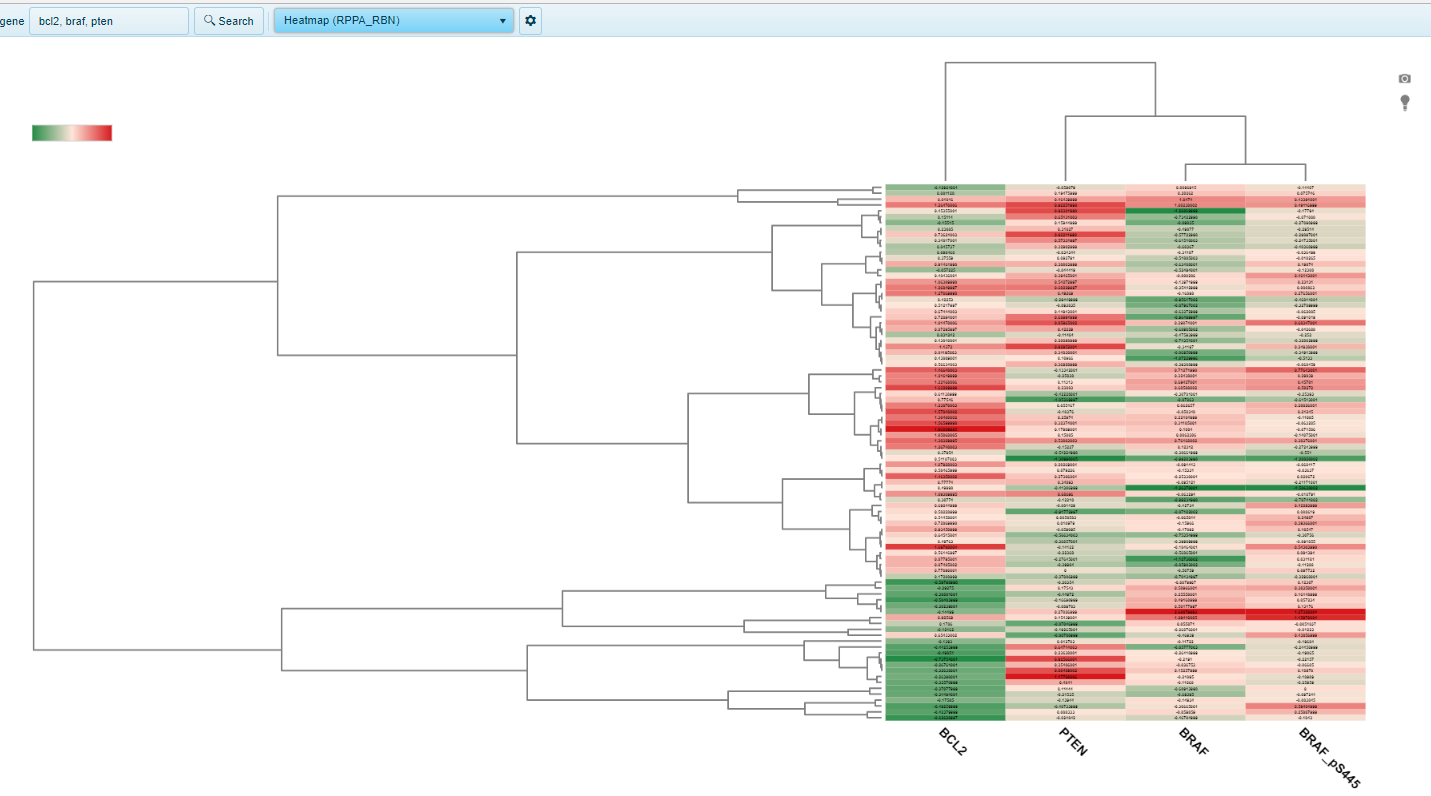
RPPA_RBN Heatmap
This heatmap RPPA_RBN view shows reverse phase protein array ratio (sample vs universal human reference) for group (e.g. Tumor type) for multiple genes, with replicate-based normalization for cross-tumor comparisons (RBN). Each gene searched is identified by column, while each sample is represented as a row. RPPA data was only generated for a subset of genes, so this view may not be available for many genes.