Measurement Data
Measurement data is orthogonal data associated with Land Omics Data, such as compound/drug screening and RNAi data. User can add measurement data to create views and query the land omics data.
Import Measurement Data
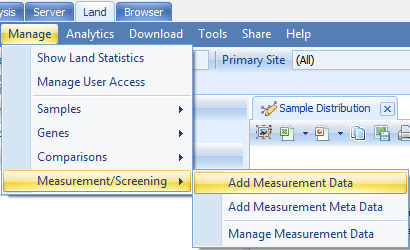
In this tutorial, we are using a cell line land data as one example since it has drug screening data. User can add measurement data in Manage | Measurement | Add Measurement Data:
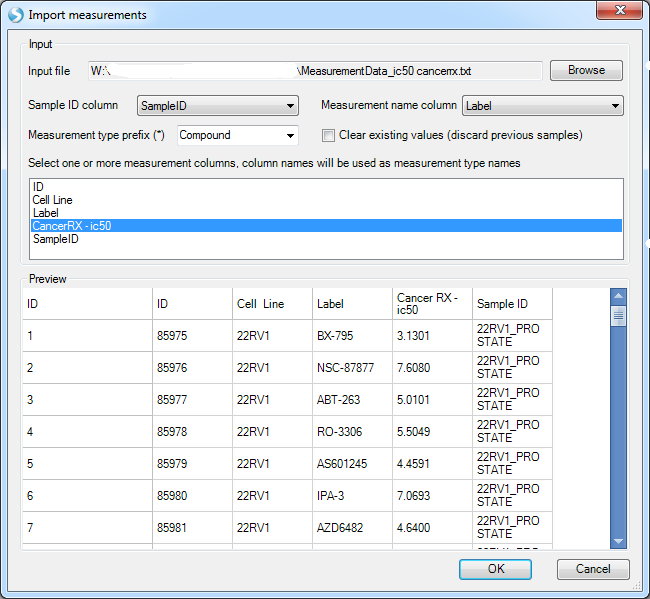
The measurement data source file should have columns for Sample ID matching Land samples, measurement label column containing compound/screening names, and one or more measurement columns. Example of IC50 table below:
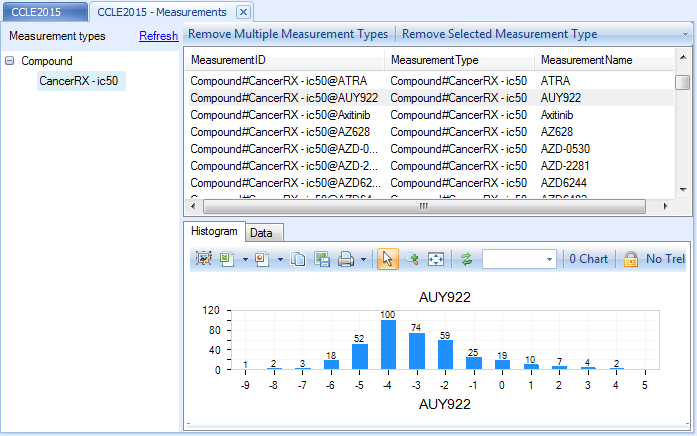
User can browse the measurement data using Manage | Measurement | Manage Measurement Data:
User can also add measurement meta data in Manage | Measurement | Add Measurement Meta Data
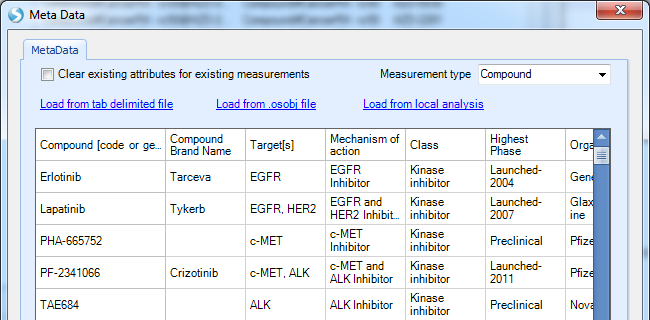
These meta data will be attached to each compound when browsing them in Manage Measurement Data window.
Search/Visualize Measurement Data
Once measurement data is imported, the measurement labels (such as compound names) are searchable in the search box:

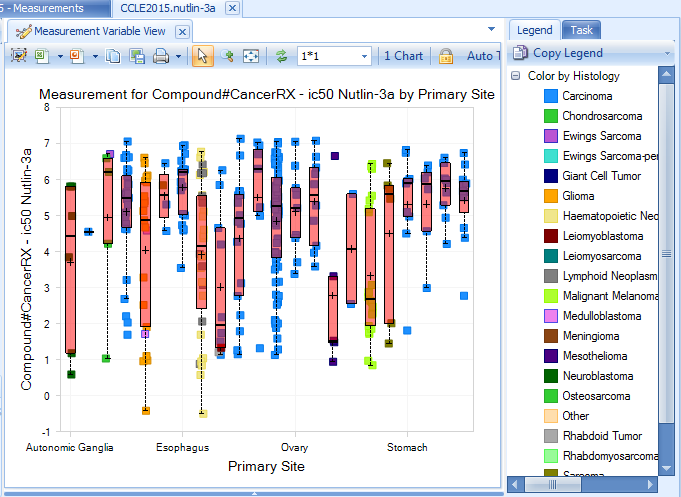
There are boxplot and heatmap views for this compound:
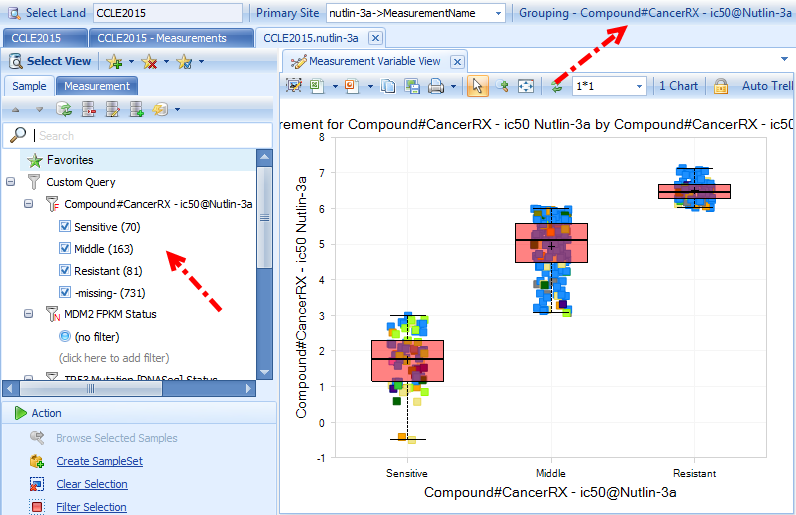
Measurement Data Query
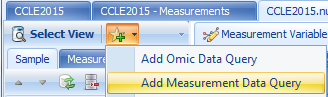
Measurement data can also be used to query Land Omic Data in custom query in any Sample tab:
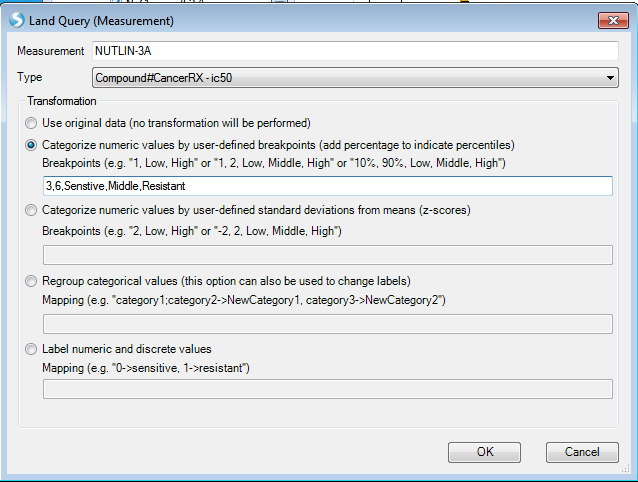
User can categorize the measurement data into categories, such as sensitive and resistant, using numeric break points or directly labeling. Here we categorize the drug IC50 values for Nutlin-3a by:
- <3: sensitive
- Between 3 and 6: middle
-
6 Resistant
The custom query results can be used as a filter and profile column in views for Omics data.