RNA-Seq Mutation Views
RNA-Seq Somatic Mutation Distribution
Similar to the DNA Somatic Mutation Distribution View, this view displays histograms of RNA-Seq Somatic Mutation Distribution or RNA-seq Mutation Distribution. In this view, mutation events will be calculated as a percentage of affected samples in each group. As you can see in the view below, for the gene EGR1, only mutations are plotted. In the legend, a full description of the type of mutation (INDEL, Deletion, Substitution) will be displayed.
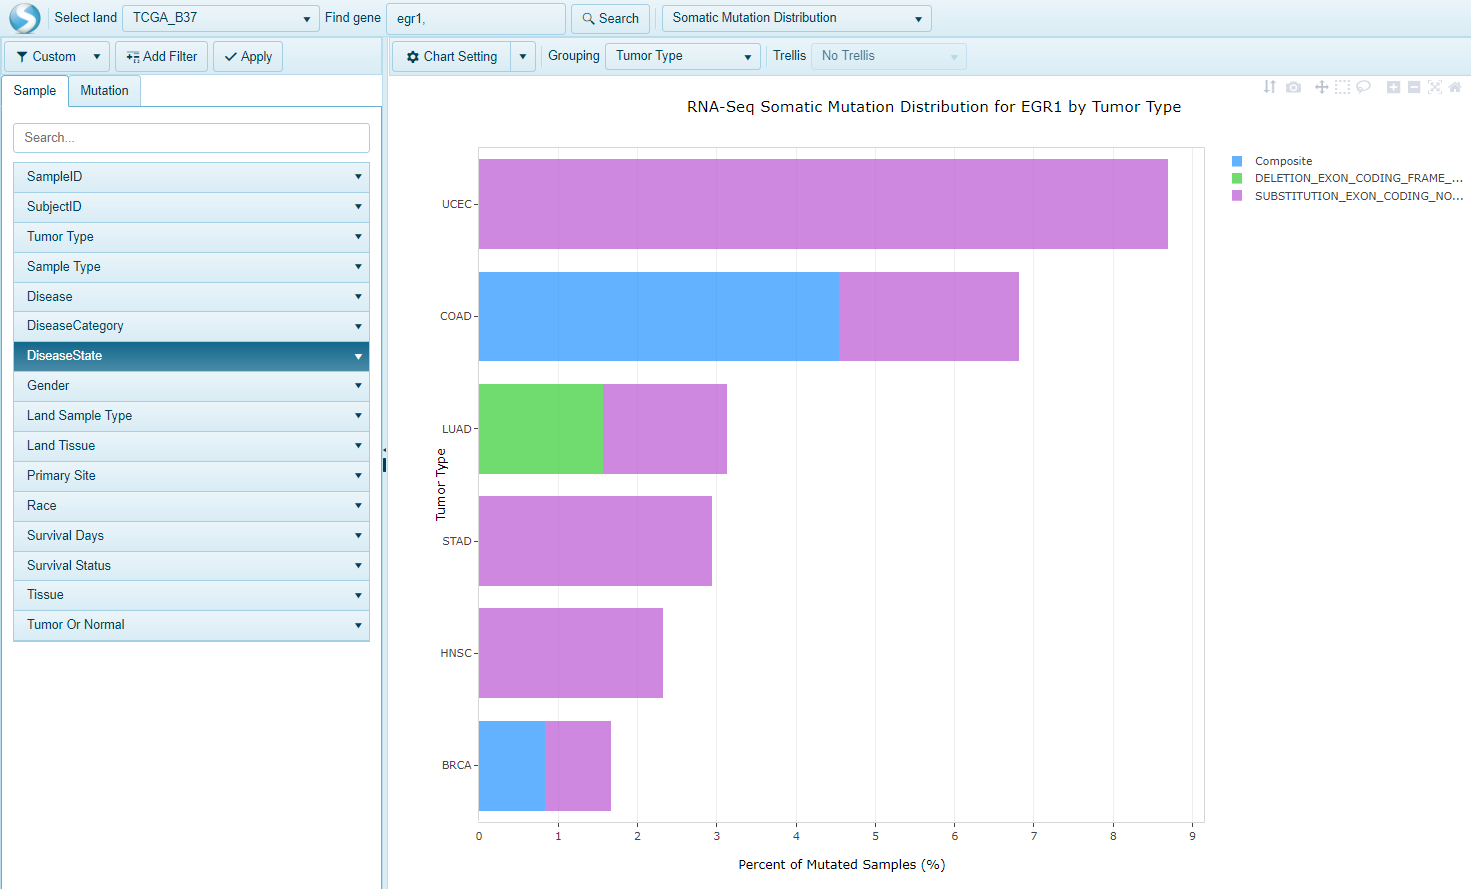
The X-axis shows the percent of mutant samples, while the samples are grouped on the X-axis by the grouping column. Only groups with any mutations available in that gene will be plotted in the view.
Use the Sample Tab to change filtering options on the samples (or to change grouping). Use the Mutation tab to filter for specific Amino Acid mutation (OS_AAMutation), Annotation Type (i.e non-synonymous via OS_AnnotationType) and more. For more information on filtering in Land Explorer, please see the filtering guide
Select one or more bars from the plot and choose Details for Selection to find out more details on the selected samples.
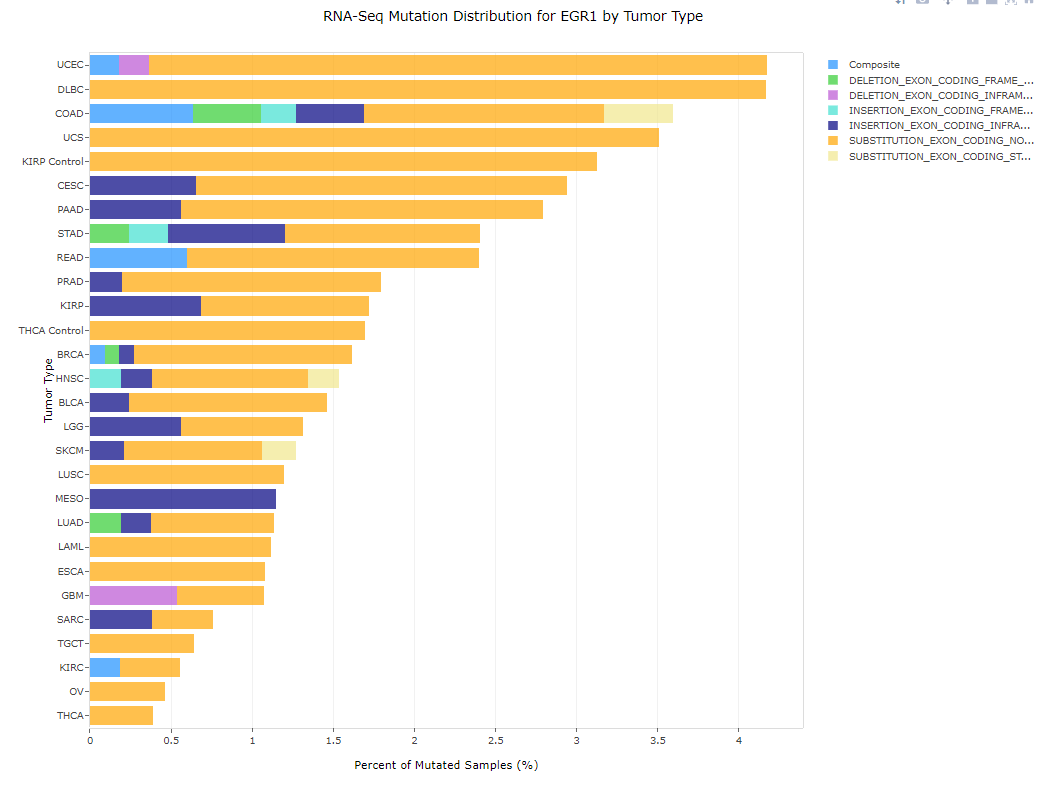
Note: In different Lands, RNA-seq mutation data will be presented as RNA-Seq Somatic Mutation or RNA-Seq Mutation. This reflects the difference in mutation calling. For Somatic Mutation calls, matched normal samples can be used to filter out the germline variants. For RNA-seq Mutation calls, no matched normals are available. In this case, since variation from germline is not filtered, there may be more mutations seen in this view:
RNA-Seq Somatic Mutation Distribution by Gene
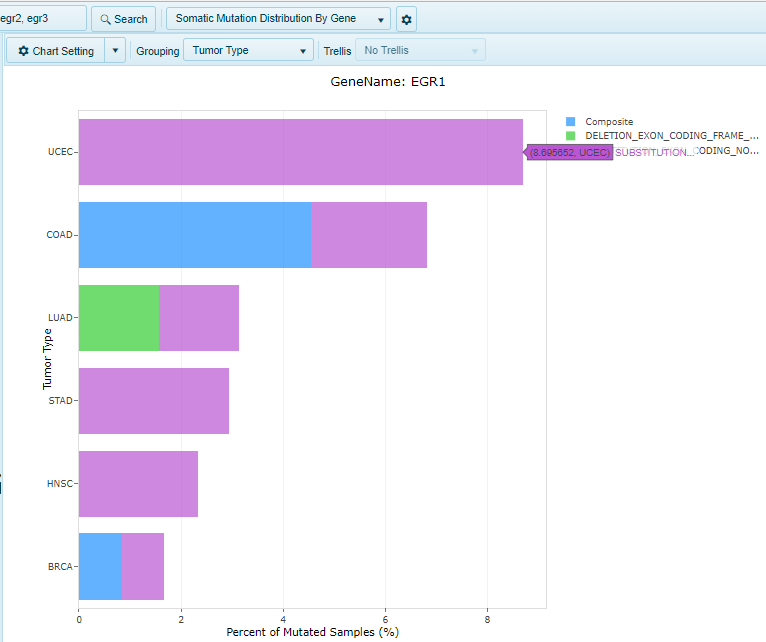
For multi-gene searches, all RNA-Seq mutation data will be compared for the genes in the search to identify samples with a mutation in any of the genes queried using the Somatic Mutation Distribution View. If a user is interested in the per-gene distribution of samples (rather than compounded distribution), the "Somatic Mutation Distribution By Gene" will generate one chart per gene queried.
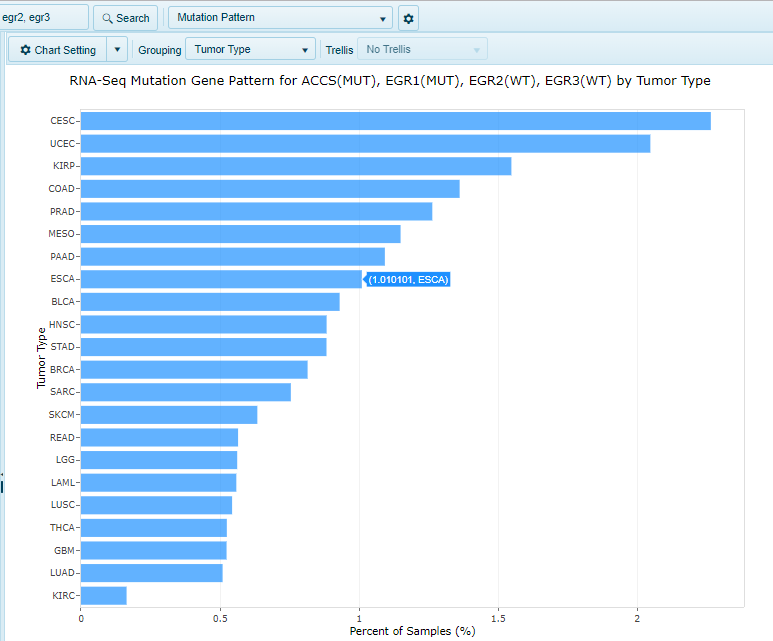
RNA-Seq Mutation Pattern
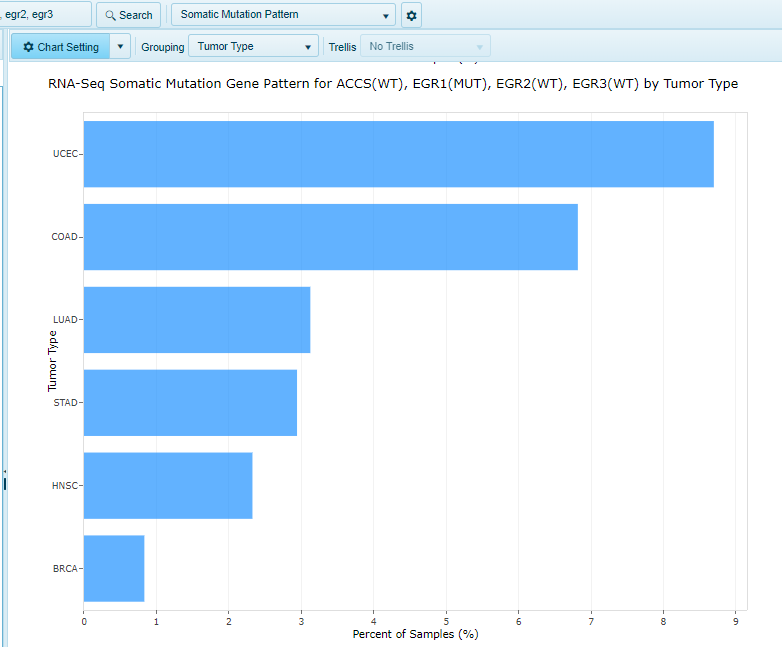
The RNA-Seq somatic mutation pattern view shows a bar plot with the number of mutations matching a particular pattern for the specified gene set across a grouping (e.g. Tumor Type/sample type). X-axis shows the number of mutations matching the pattern, while Y-axis shows the grouping.
RNA-Seq Mutation Site Distribution
Similar to the DNA Somatic Mutation Site Distribution View, this view for RNA-seq mutation data will plot the RNA-seq mutations for each gene queried:
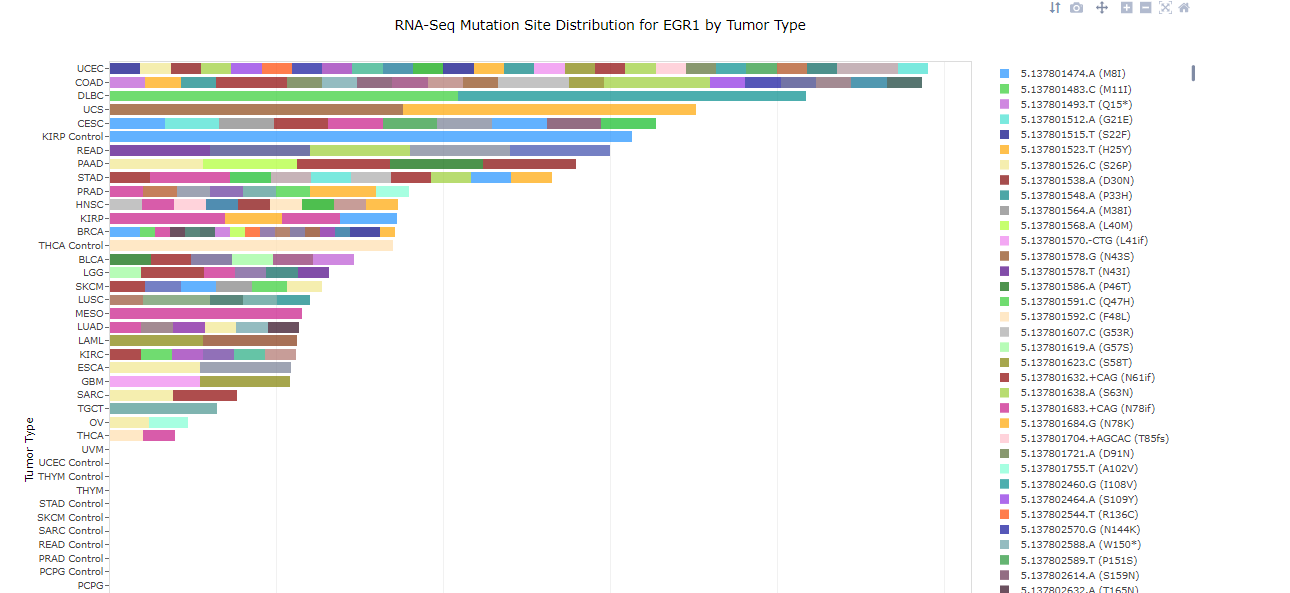
All alleles identified for that gene will be represented on the x-axis as a unique color in the plot. The gene-level distributions for RNA-seq mutations can be displayed for RNA-seq Somatic mutation and RNA-seq Mutation data.
RNA-Seq Somatic Mutation Gene Pattern