Visualization of Data
The TableView
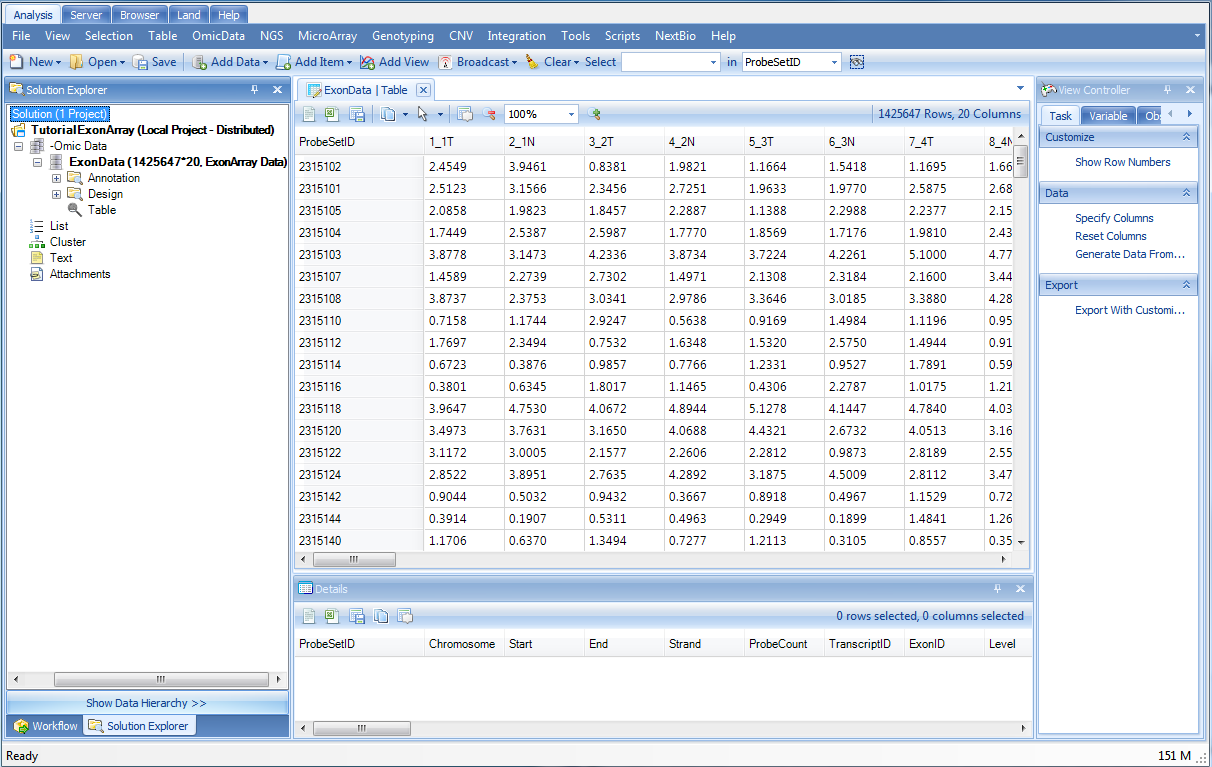
At this point, the screen should look similar to below. On the left, the Solution Explorer should be visible. In the center of the screen, a table view called Table should be visible.
Scroll through the dataset to see how quickly Array Studio is able to scroll. Array Studio is able to easily handle millions of rows and columns in the TableView.
Please refer to Microarray Tutorial for different options and filters for TableView.
Details Window/Web Details
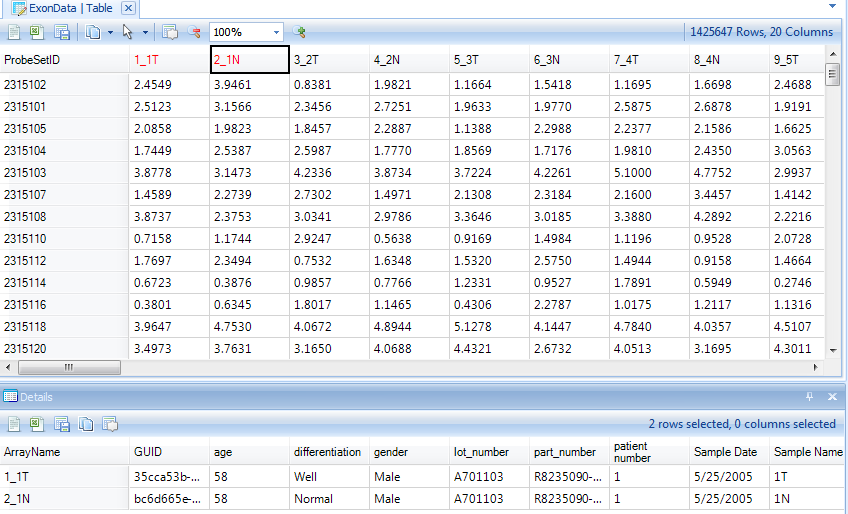
The TableView, and all other views in Array Studio, are fully interactive. Clicking on particular column headers or row headers will bring up details about those observations or variables in the Details Window.
In the TableView, click the column header cell for 1_1T and 2_1N. Notice that the sample information for these 2 selected sample IDs are shown in the Details window.
If the Details Window is not shown at the bottom of the screen, go to View Menu | Show Details Window now to show it.
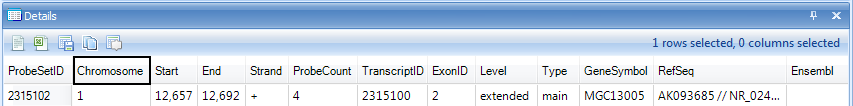
The user can also click on the row header cell to show annotation for any variable. Do this now, and notice that the Details Window updates with the annotation for that particular probeset.